Consumer Services Sector

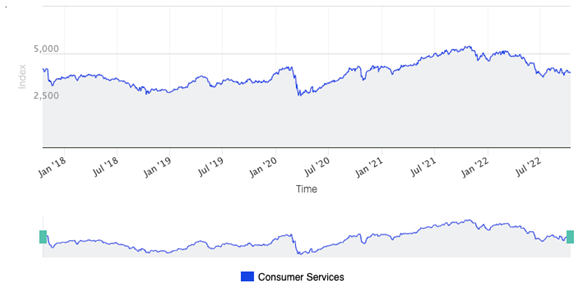
The size of the consumer services sector in Saudi Arabia is 2,403,811 riyals and has seen a decline of almost 5.72% over the last five years.

The consumer services sector consists of 3 sub-sectors, hotels and resorts, restaurants, and other consumer services, where the market share of the hotel sector is 28.742 billion riyals, the other consumer services sector is 13.094 billion riyals, and the restaurant sector is 7.384 billion riyals. Under the segment are 12 companies in the Tadawul market and one in the Nomou market, Seera Holding Group holds the largest share of the sector with 29% followed by Abdulmohsen Al Hokair Group and then Gulf Company, with 18.1% and 17.6% respectively. The trading volume of the sector is 3061265 riyals, where the percentage of returns during the year reached -25.55%.
In today's analysis, we will look at 3 companies from the sector using the DuPont analysis, Seera Group Holding, Herfy, and Fitness Time.
DuPont analysis helps investors and financial analysts analyze a company's return on equity (ROE) to its component. The analysis provides insights into the main drivers and shortcomings of the return on equity measure by dividing it into multiple multiples, profitability, leverage, and asset use efficiency. This methodology allows for a distinction between profitable enterprises and highly leveraged entities.
Each multiplier is represented using one of its ratios, as the net profit margin represents the profitability multiplier, the asset turnover ratio represents the efficiency of asset use, and the equity multiplier represents the company's leverage.
Net profit margin:
The profit margin can be improved if costs for the owner were reduced or if prices were raised, which can greatly impact ROE. This is one of the reasons that a company's stock will experience high volatility levels when management changes its guidance for future margins, costs, and prices.
Assets turnover:
The asset turnover ratio evaluates how well a business generates revenue from its assets.
The asset turnover ratio will differ from industry group to industry group. For instance, a grocery shop or discount retailer may generate a large amount of revenue from its assets with a low profit margin, which will result in a high asset turnover ratio. In contrast, a utility business has relatively expensive fixed assets compared to its revenue, which results in a lower asset turnover ratio than a retail company.
When comparing two businesses that are relatively similar, the ratio might be useful. Changes in this ratio might indicate that sales are slowing or accelerating earlier than they would appear in other financial indicators since typical assets include items like inventories. A company's ROE increases when asset turnover rises.
Finance leverage:
A company's use of debt to fund its assets is indirectly analyzed by financial leverage, also known as the equity multiplier. Consider a business with $1,000 in assets and $250 in owner equity. As stated in the balance sheet calculation (assets - liabilities = equity), the corporation also owes $750 in debt. The ratio will increase if the business takes out additional debt to buy assets.
Most businesses should balance debt and equity to finance operations and expansion. Lack of leverage might put the business at a disadvantage when compared to its competitors. However, taking on excessive debt in order to raise the financial leverage ratio and, thus, the ROE, might lead to unjustified risks.
A high ROE generally means that the rate of return on shareholders’ equity is going up and that the company is doing a good job of growing profits without adding new equity into the business.
A high and consistent ROE can signal the company's competitive advantage over its competitors.
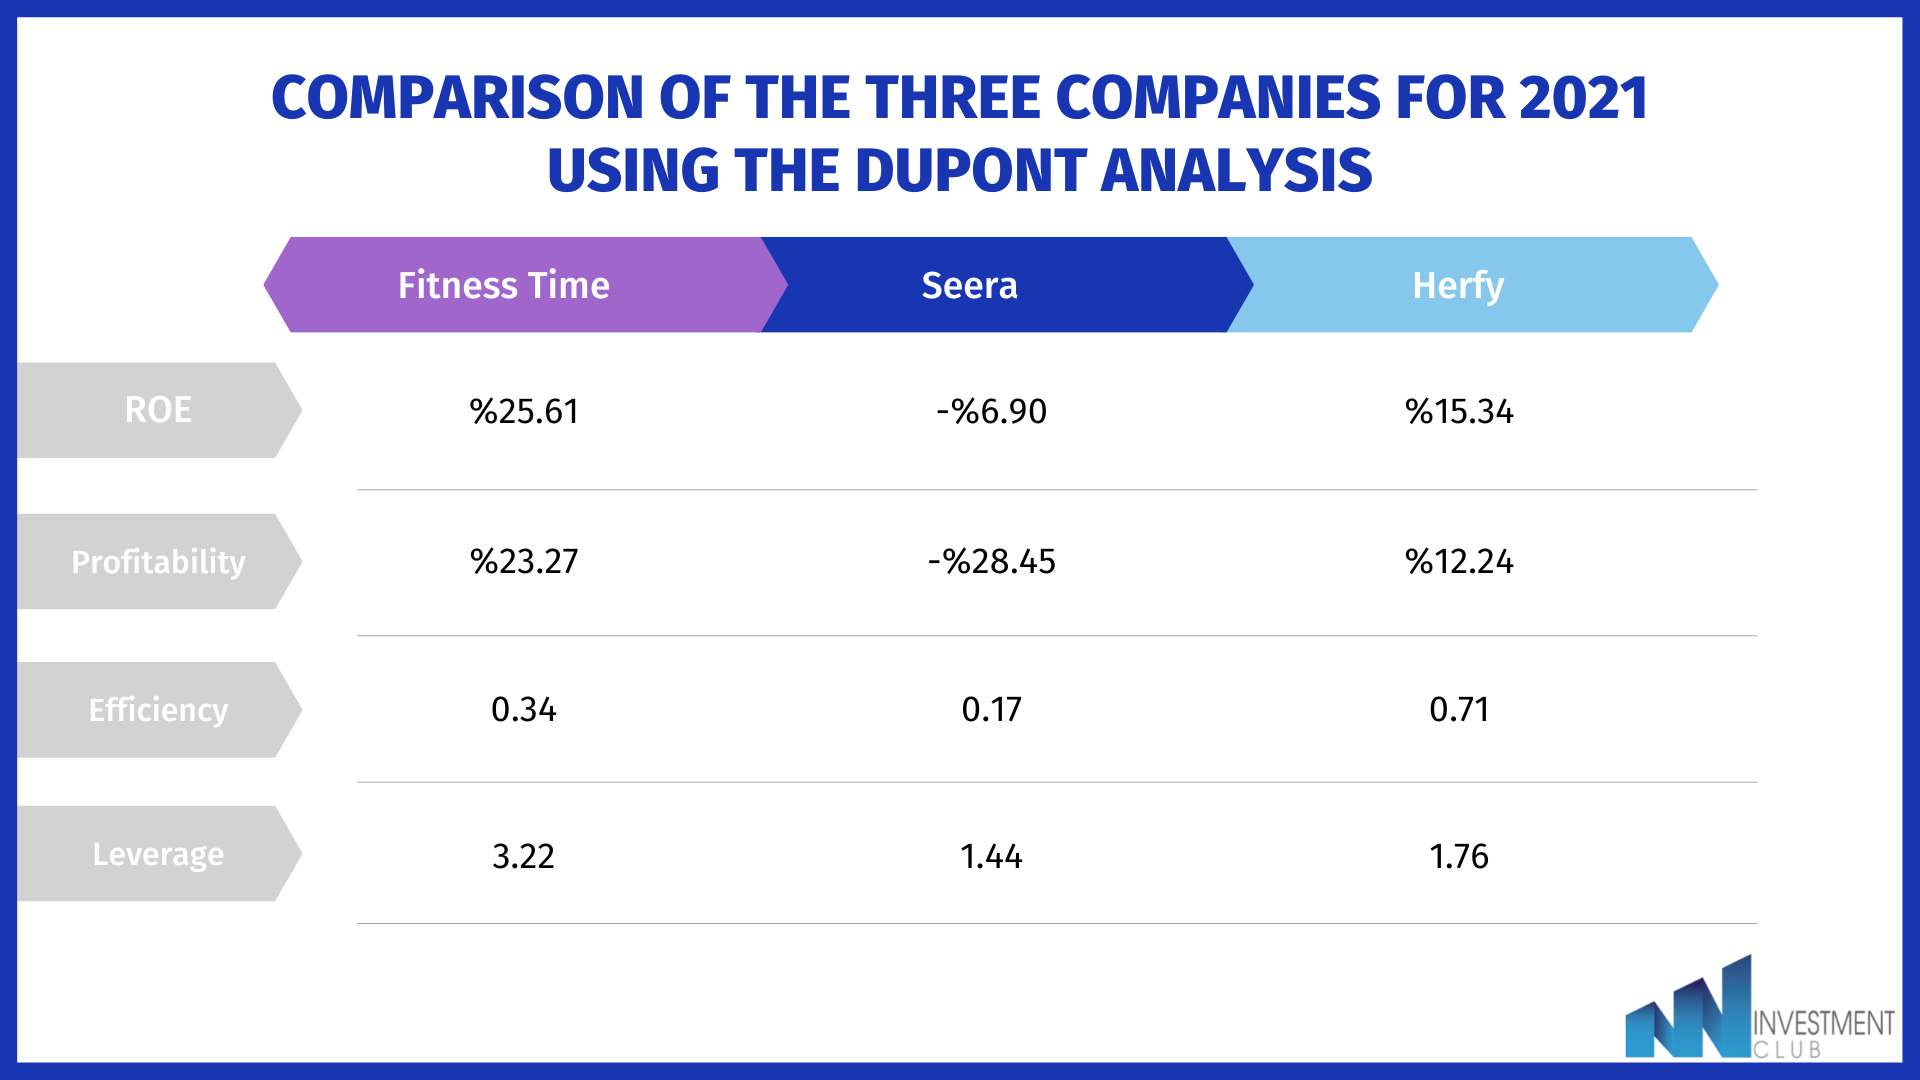
Here we illustrate a comparison of the three companies for 2021 using the DuPont analysis

As shown, fitness time represents the largest percentage of the return on equity and this is due to the increase in profitability and leverage, which means that the company's revenues are greater than its expenses and that its debt is larger compared to Seera Holding Group and Herfy.
Seera Group Holding represents the lowest rate of return on equity due to the significant decrease in profitability, the low efficiency of its use of its assets as well as the low leverage compared to the other two companies.
Herfy has been more efficient in using its assets as this is reflected in the higher rate of return on equity compared to Seera Holding Group.
Finally, we give you a link to see the full analysis for the last 5 years:
Resources:
Tadawul
Mobasher
Prepared by:
Aseel AljuailanShahad
alwahbyShahla Alotaibi
Raghad Alnafisah
Leen Alsulaiman